Benford's Law in Fraud Investigations
Leading digits in genuine payment data follow a predictable curve. Learn when Benford’s law flags fabricated amounts and when the test misleads.
- Published
- Updated
Benford’s law predicts that smaller leading digits appear more often in many naturally occurring sets of amounts. Investigators compare payment amounts with that pattern to select transactions for examination. A departure can expose fabricated amounts or payments arranged around approval limits, but the digit pattern alone never proves fraud.
What the Benford Distribution Predicts
Benford’s law describes an uneven distribution of first digits, with 1 appearing most often and 9 least often. Simon Newcomb first described the pattern in 1881. Frank Benford later examined it across many data sets in 1938.
The first digit is the first non-zero digit of an amount. Both $1,250 and $0.12 begin with 1 for this test. Zero amounts have no first non-zero digit and are excluded.
The expected proportion for a digit d is log10(1 + 1/d). The table gives the expected percentages.
| First digit | Expected share |
|---|---|
| 1 | 30.10% |
| 2 | 17.61% |
| 3 | 12.49% |
| 4 | 9.69% |
| 5 | 7.92% |
| 6 | 6.69% |
| 7 | 5.80% |
| 8 | 5.12% |
| 9 | 4.58% |
A proportionally growing amount takes longer to move from 100 to 200 than from 900 to 1,000. This helps explain the excess of low leading digits. Financial amounts spanning several orders of magnitude can show the pattern, especially when many small payments sit alongside fewer large ones.
The range alone does not guarantee conformity. The process producing the amounts matters. Formann’s study of Benford distributions shows why some ordinary distributions still fail to fit.
Which Financial Data Suits the Test
Vendor payments, expense claims and journal-entry amounts can suit a digit test when their values arise from varied transactions. Start with at least several hundred records in a coherent population. A larger population gives more observations for each digit, particularly when testing the 90 first-two-digit combinations.
Examine how the amounts arise before interpreting a difference. Nigrini’s explanation of financial digit testing distinguishes transaction quantities from assigned numbers and bounded amounts.
| Population | Effect on interpretation |
|---|---|
| Vendor payments across a broad range | A candidate population if transaction values arise from varied purchases |
| Expense claims with a reimbursement cap | The cap changes which leading digits can occur |
| Fixed monthly fees | Repetition reflects the contract, even when the payment is legitimate |
| Payments from a short price list | Prices constrain the possible digits |
| Account numbers or invoice identifiers | People assign these numbers, so the amounts model does not apply |
| A small sample | Random variation can create apparent spikes without manipulation |
Expense claims can contain both variable purchases and capped allowances. Separate those populations using a documented rule. Similarly, repeated payroll or fixed rent can dominate a bank account and make a combined digit test misleading.
Keep business causes of a spike visible. A lawful approval limit can itself truncate the population. Testing only amounts below that limit against the unrestricted Benford curve can therefore create a false signal.
Running a Digit Test on Bank Transactions
A bank-transaction digit test compares the counts from a defined ledger population with Benford’s expected counts. Preserve the original amount and its source reference throughout preparation. The investigation must be able to return from a digit bar to the transactions behind it.
- Define the population before calculating the result. For example, select vendor-payment debits in one currency over the supplied period. Record the accounts and categories included.
- Reconcile the selected ledger with the supplied records. Identify missing periods and duplicate extraction rows. Distinguish duplicate rows from separate payments of the same amount.
- Separate debits from credits. Refunds and reversals can have a different generating process, so test them separately when relevant. Use positive magnitudes within each defined group.
- Exclude zero and non-numeric values. Retain a record of every exclusion. Extract the first non-zero digit, then the first two significant digits for the more detailed test.
- Count the digits and divide each count by the population size. Multiply the Benford proportion by that size to obtain its expected count. Plot actual proportions against the expected curve.
- Calculate conformity measures, then inspect the transactions contributing to the largest differences. Confirm that each count can be reproduced from the retained ledger.
FinTrace saves forensic accountants hours of statement preparation by turning PDF bundles into a searchable, categorised Excel ledger. The ledger retains source fields for your own analysis. This gives you the amounts and supporting statements together when defining a payment population.
A Fictional Payment Population
This illustration contains 1,040 fictional payments in Australian dollars. We generated 1,000 amounts across $10 to $100,000 on a logarithmic scale. We then inserted 40 payments between $4,900 and $4,978 to illustrate a cluster below a $5,000 approval limit.
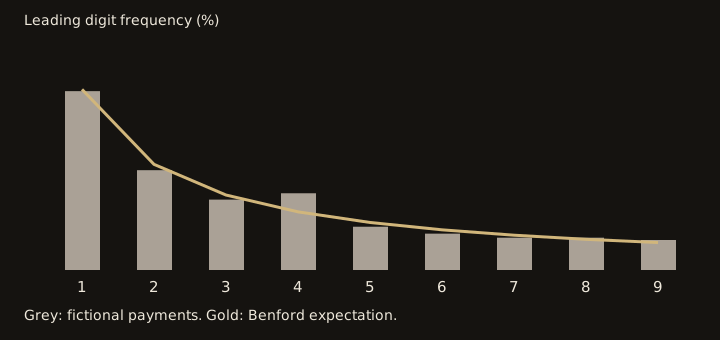
The gold line shows the expected distribution. Grey bars show the fictional counts. The inserted payments raise the share beginning with 4. The underlying values are synthetic and demonstrate the calculation, without implying a measured fraud-detection success rate.
| First digit | Fictional count | Observed share | Expected share |
|---|---|---|---|
| 1 | 310 | 29.81% | 30.10% |
| 2 | 173 | 16.63% | 17.61% |
| 3 | 122 | 11.73% | 12.49% |
| 4 | 133 | 12.79% | 9.69% |
| 5 | 75 | 7.21% | 7.92% |
| 6 | 63 | 6.06% | 6.69% |
| 7 | 56 | 5.38% | 5.80% |
| 8 | 56 | 5.38% | 5.12% |
| 9 | 52 | 5.00% | 4.58% |
What the Measures Tell You
Mean absolute deviation (MAD) is the average absolute difference between the observed and expected digit proportions. For a first-digit test, add the nine absolute differences and divide by nine. Use proportions between zero and one, not percentages between zero and 100.
Cerqueti and Maggi’s published discussion of conformity thresholds reports Nigrini’s first-digit boundaries of 0.006, 0.012 and 0.015. These mark close, acceptable and marginally acceptable conformity. Values above 0.015 fall outside those conformity bands. These empirical labels describe fit, not the probability of fraud.
The fictional example has MAD of 0.00842. That overall average can conceal a concentrated difference in one digit. Inspect each bar even when the aggregate measure looks acceptable.
Chi-square adds the squared difference between each observed and expected count, divided by its expected count. Under the test’s assumptions, its p-value measures evidence against the specified digit distribution. A large sample can make a small departure statistically significant. Sparse expected counts make the usual chi-square approximation unreliable.
A first-two-digit test uses the combinations 10 through 99. Its expected proportion for a pair n is log10(1 + 1/n). Apply thresholds intended for that test, because first-digit MAD bands do not transfer to 90 categories.
In the fictional example, the inserted payments begin with 49. Retrieve those rows, then inspect their actual amounts near $5,000. A 49 spike also contains $49 and $490 amounts, so the digit pair alone cannot locate the approval-limit cluster.
Reading a Spike Without Overreaching
A digit spike selects transactions for document sampling and further explanation. Examine the invoices and approval records behind those payments. A legitimate fixed charge, a reimbursement rule or a changed supplier mix can explain a departure.
A cluster just below an authorisation threshold can point to split payments. In a hypothetical case, one supplier receives $4,950 and $4,980 for the same order within two days. Each payment falls below a $5,000 approval limit, while the combined $9,930 exceeds it.
Compare the purchase order with the invoices and the applicable approval policy. Establish whether the transactions form one purchase and whether that policy applies to their combined value. The amounts and timing justify those enquiries. They do not establish deliberate evasion without the surrounding evidence.
Correct interpretation: “Amounts beginning with 49 are overrepresented. Inspect payments near the approval limit and test whether related invoices divide one purchase.”
Incorrect interpretation: “The 49 spike proves that the payments are fraudulent.”
Accounts payable fraud investigations examine the payment schemes and documents behind such clusters. Combine digit results with the other tests described in forensic data analytics. Fraud can remain hidden in data that conforms closely to Benford’s law.
Benford Results in Expert Evidence
An expert using Benford results must explain the data selection and reasoning behind the opinion. A chart needs the underlying transactions and a reproducible calculation to support it.
In the Federal Court, the Expert Evidence Practice Note requires the expert’s report to identify assumptions and material facts. It also requires reasons and supporting materials. Paragraph 5.3 requires referenced calculations, analyses and other extrinsic material to accompany the report for other parties.
For a digit test, disclose the complete tested data set and how it relates to the source records. Explain exclusions, handling of reversals and currency treatment. State which digits you tested and which conformity measure you used. Preserve the spreadsheet formulas or code needed to reproduce the result.
An opposing expert can challenge a population dominated by fixed fees, unexplained exclusions or an unsuitable statistical approximation. They can also test whether selecting several populations and reporting only the largest spike distorts the result. Disclose the tests run and explain why the reported population suits Benford’s distribution.
The expert witness code of conduct explains the broader duties attached to opinion evidence. Produce the relevant transactions and supporting documents so the court can assess the factual explanation for the spike alongside the statistical result.
FinTrace
Statements in. Evidence out.
FinTrace turns your bank statements into one searchable Excel ledger and a written findings report, with every finding cited to its source page.
FinTrace
See how FinTrace works